



The data is there—in orders, reports, and notifications. But no one takes it into account when decisions are made.
Dashboards & Analytics
Live Service Metrics: From Open Requests to Utilization
Response times, turnaround times, system-specific issues, overdue maintenance: In SIMPL, you can see the metrics you actually use to manage your service—in real time, rather than at the end of the month.




Management is based on intuition and tracked in Excel at the end of each month

Key metrics scattered across various systems and Excel spreadsheets
Monthly reporting takes hours and is already out of date by the time it’s sent out
No one knows for sure which investment or order type costs money
Overdue maintenance isn’t noticed until the customer calls


All key service metrics, at a glance and in one place
SIMPL analyzes the data your team collects anyway: inquiries, orders, times, and reports. No extra effort, no Excel.

Live overview of all ongoing processes
Insights on Inquiries and Orders: Trends Instead of Gut Feelings
In-depth analyses by facility, customer, and order type

"
Since the introduction of SIMPL, we have been systematically tracking our machines and equipment in the annealing technology sector. As a result, we now have complete transparency regarding our entire installed base, including maintenance records. Customer inquiries can be submitted directly via the QR codes on the equipment, and the tedious task of printing out manuals is finally a thing of the past.
Ralf Bistritz
Authorized Signatory at WELDOTHERM Gesellschaft für Wärmetechnik m.b.H.
From a Real-Time Overview to the Right Decision
First, see what’s happening right now. Then, understand what’s changing. Then, take targeted action.
The Service Cockpit
What’s on right now? One glance is all it takes.
Open requests, ongoing assignments, today’s tasks, and responsibilities—all in real time and visible to the entire team. The morning meeting no longer needs Excel—it just needs a screen.

Open inquiries and orders with status and priority
Today’s Assignments and Responsibilities in Real Time
One booth for everyone: Service Management, Scheduling, and Office Staff
„Overall, we're working in a much more coordinated way. We can see that in our response times and in the feedback we receive from our customers.“

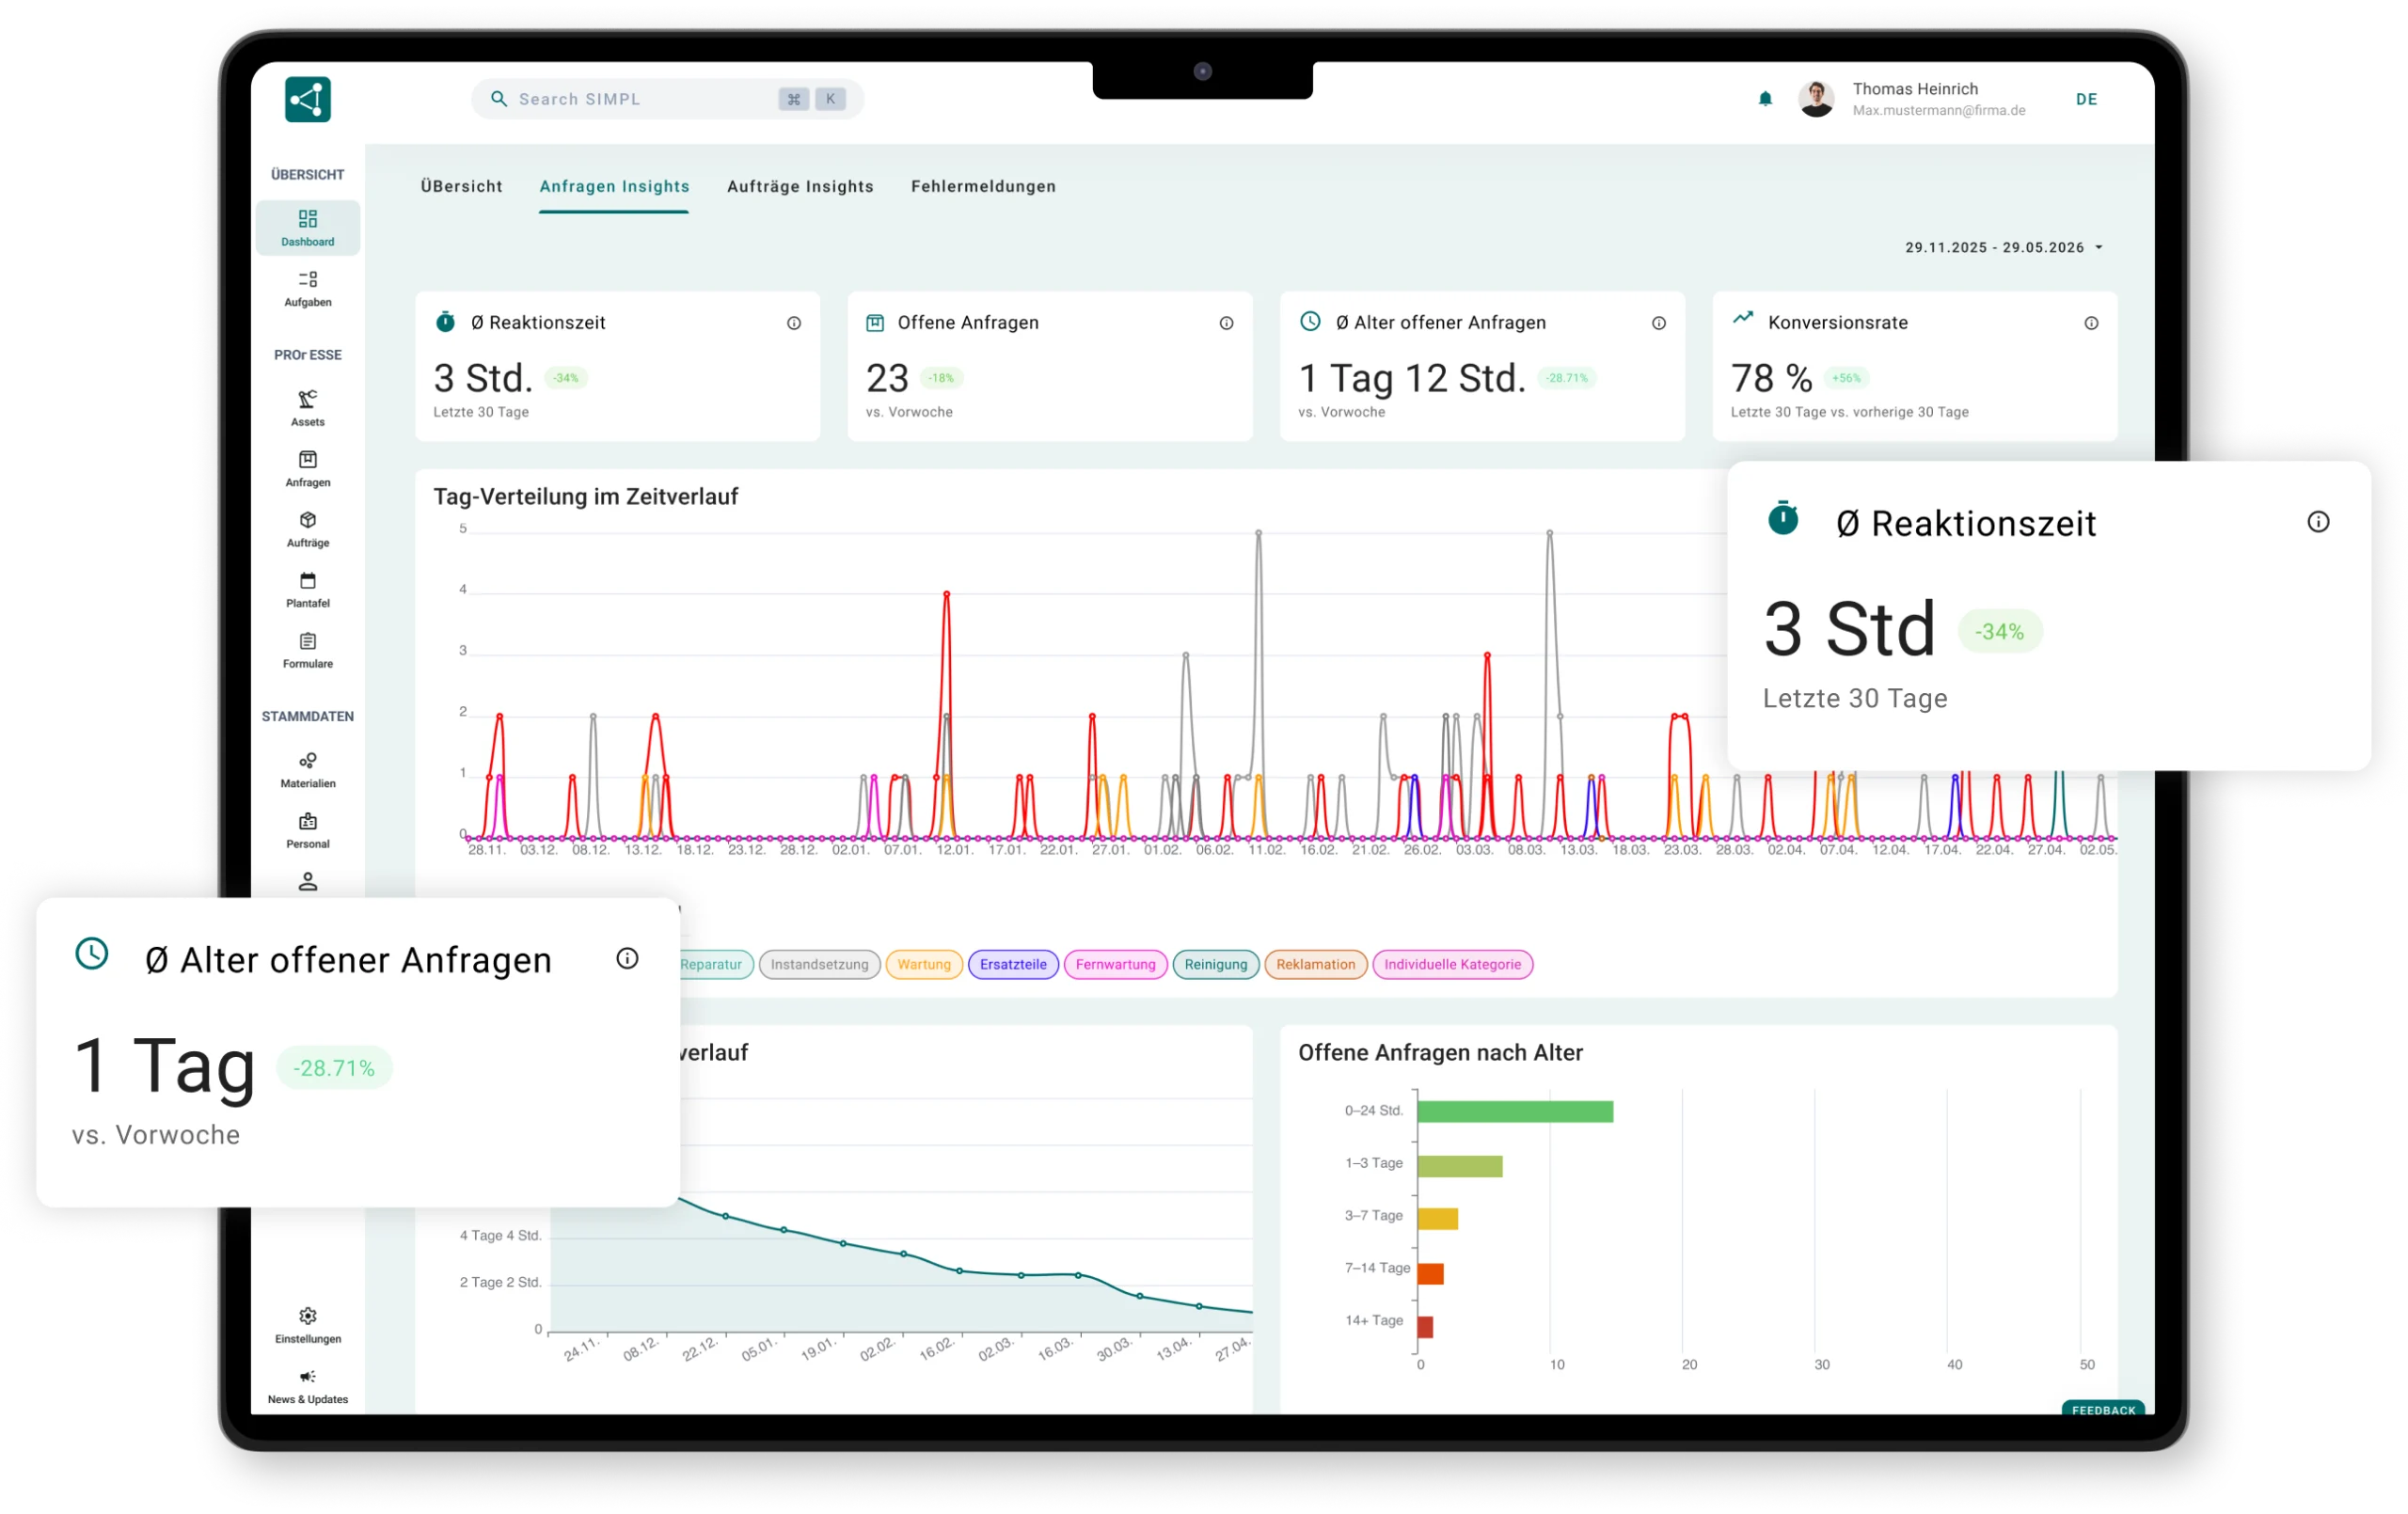
Inquiries Insights
You’ll see the traffic jam first
Volume of inquiries and response times over time, broken down by category and customer.
Volume by Inquiry Type, Customer, and Time Period
Reaction times over time, without a stopwatch
Identify clusters before they become a problem

Orders Insights
Lead Times and Capacity Utilization Over Time
How long orders take, how much your team can handle, and where time and materials are spent.
Trends in Turnaround Times and Completed Assignments
A Quick Overview of Times and Materials by Order Type
Identify Capacity Utilization, Adjust Planning

Reports by System
Which asset costs you the most?
Malfunctions, service calls, and maintenance costs per machine—so that problem areas are identified before they come to a standstill.
Frequency of Malfunctions and Service Calls by System and Type
Cost Over Time: The Factual Basis for Replacement Investments
Directly from the machine file, without data maintenance

Maintenance Under Control
Overdue? You’ll see it before the customer does
A centralized overview of scheduled and overdue maintenance tasks, including documentation of the contractual services performed.
Upcoming and Overdue Maintenance at a GlanceUpcoming and Overdue Maintenance at a Glance
Maintenance Progress by Contract and Customer
Complete documentation for audits and client meetings

Without a BI project
Key Metrics Without Fiddling with Excel or a BI Project
A BI tool can generate charts, but it doesn’t have any service data. In SIMPL, the numbers are generated as you work: Every report, every time entry, and every notification automatically feeds into the analysis.

No manual data maintenance, no reporting project
The figures are as current as the latest report
Export for further analysis, e.g., to Excel
View your service metrics in real time
In just 30 minutes, find out what metrics SIMPL automatically generates from your day-to-day service operations—without Excel and without a reporting project.

A no-obligation consultation with our experts
Specific Ideas for Managing Your Services
Personal Contact Person
No preparation needed—just bring your questions
Frequently Asked Questions About Dashboards & Analytics
What key metrics are important in service and maintenance?
The most important service metrics are response time (how quickly inquiries are addressed), turnaround time (how long a job takes), team utilization, frequency of malfunctions per system, and scheduled and overdue maintenance. Depending on the business, these are supplemented by time and materials per job, as well as the volume of inquiries by category. What matters most is not so much achieving the perfect metric as it is reliably tracking these metrics on a day-to-day basis.
Where does the data in the dashboard come from?
From day-to-day operations: Every inquiry, every order, every service report, and every time entry in SIMPL is automatically included in the reports. There’s no separate data entry for reporting—whatever your team documents serves as the data source.
Do we also need a BI tool like Power BI?
Not for managing day-to-day service operations: Cockpit, Insights, and reports for each system are included in SIMPL, with no setup project required. If you also run company-wide analyses, you can export the data and continue working with it—it belongs to you.
How up-to-date are the figures?
Live. As soon as a technician submits a report or a request is received, the statistics are up to date—even if the report was entered offline and will not be synchronized until the next connection.
At what point do service metrics become worthwhile?
Right away—especially for small teams. Without metrics, decisions are based on gut feeling, and that’s where gut feelings are most misleading—especially when no one has time to analyze the data. Since the metrics in SIMPL are generated automatically, there’s no reason to wait until the service is “big enough.”
Intuitive operation that works right away
SIMPL is designed so that technicians, service managers, and workshop teams can start using it right away—without lengthy training and without feeling overwhelmed.

Offline Capability for Your Technicians
Technicians can enter orders, forms, and photos completely offline—everything is automatically synced as soon as a network connection is available again.

Hergestellt und gehostet in Deutschland
Your data is stored in certified German data centers. Perfect for mechanical engineering firms and industrial companies with strict compliance requirements.
